
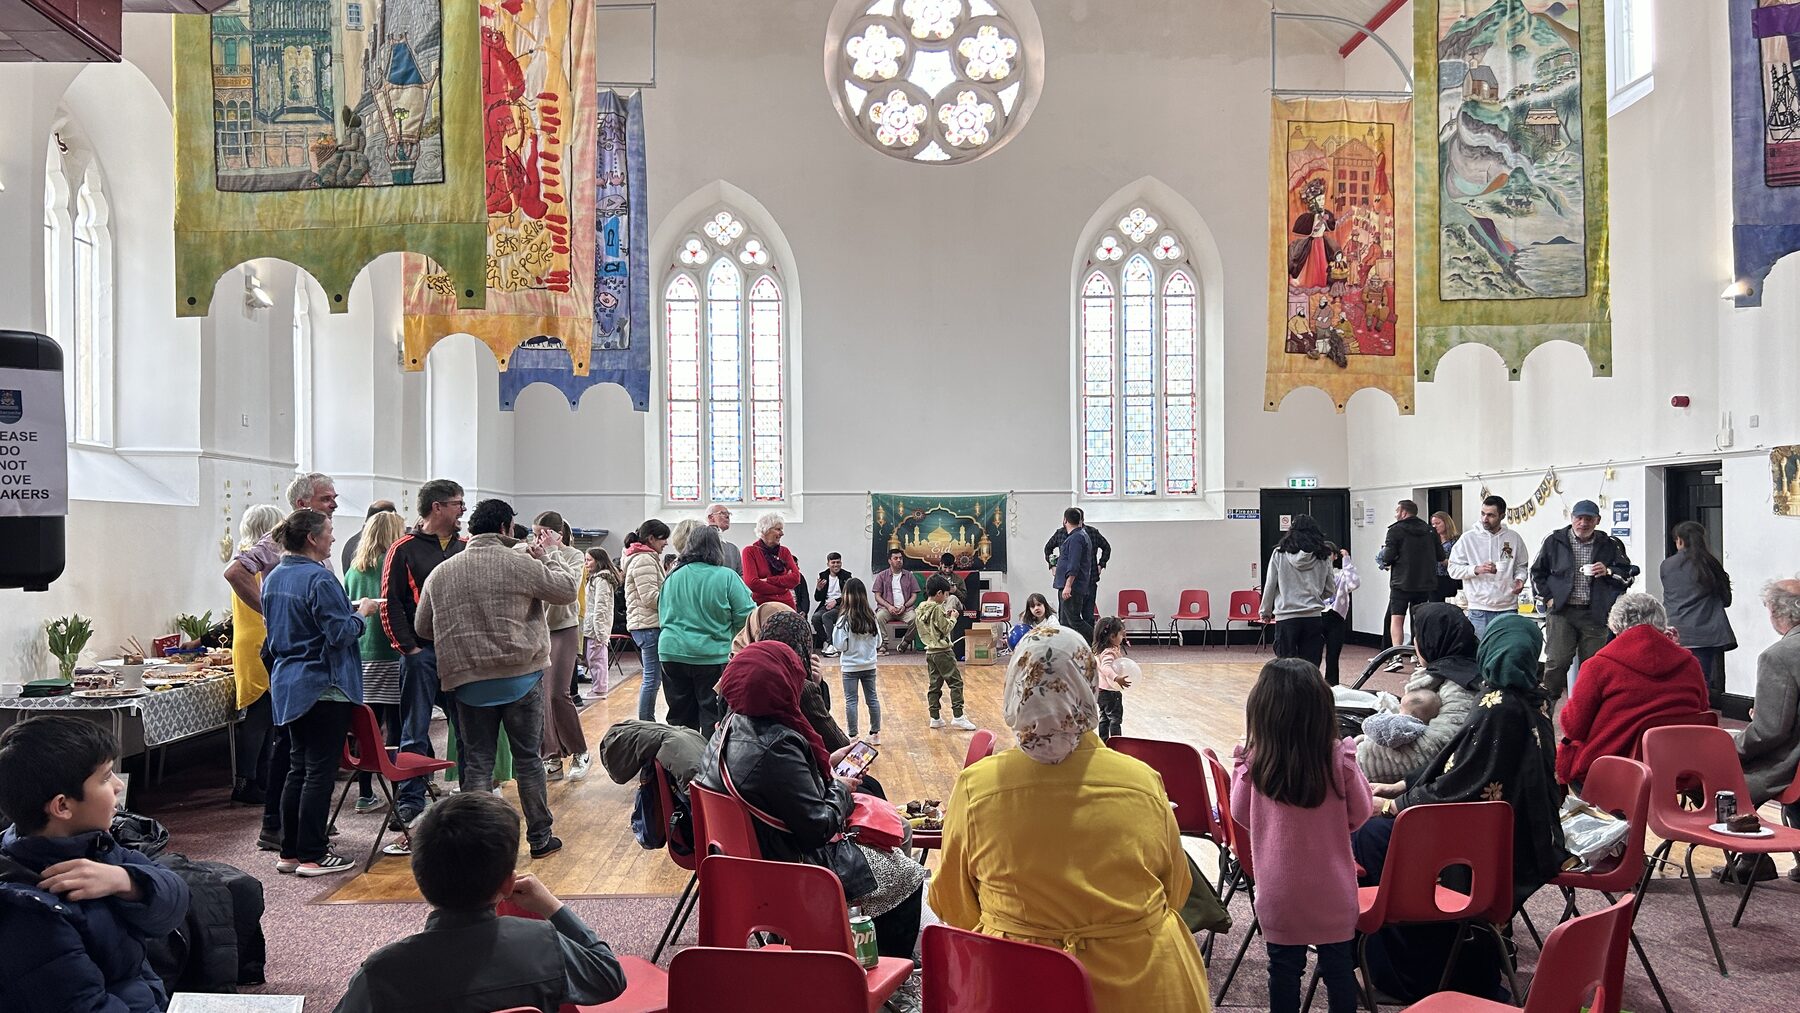
Welcome in Practice
A live picture of welcome provision across the UK, drawn from the Welcome Coalition database.
Examples of good practice
From the Welcome Coalition Impact Gallery: organisations across the UK doing inspiring welcome work.
Coexist Community Kitchen (website, opens in a new tab)
Cooking classes for refugees and asylums seekers, Bristol
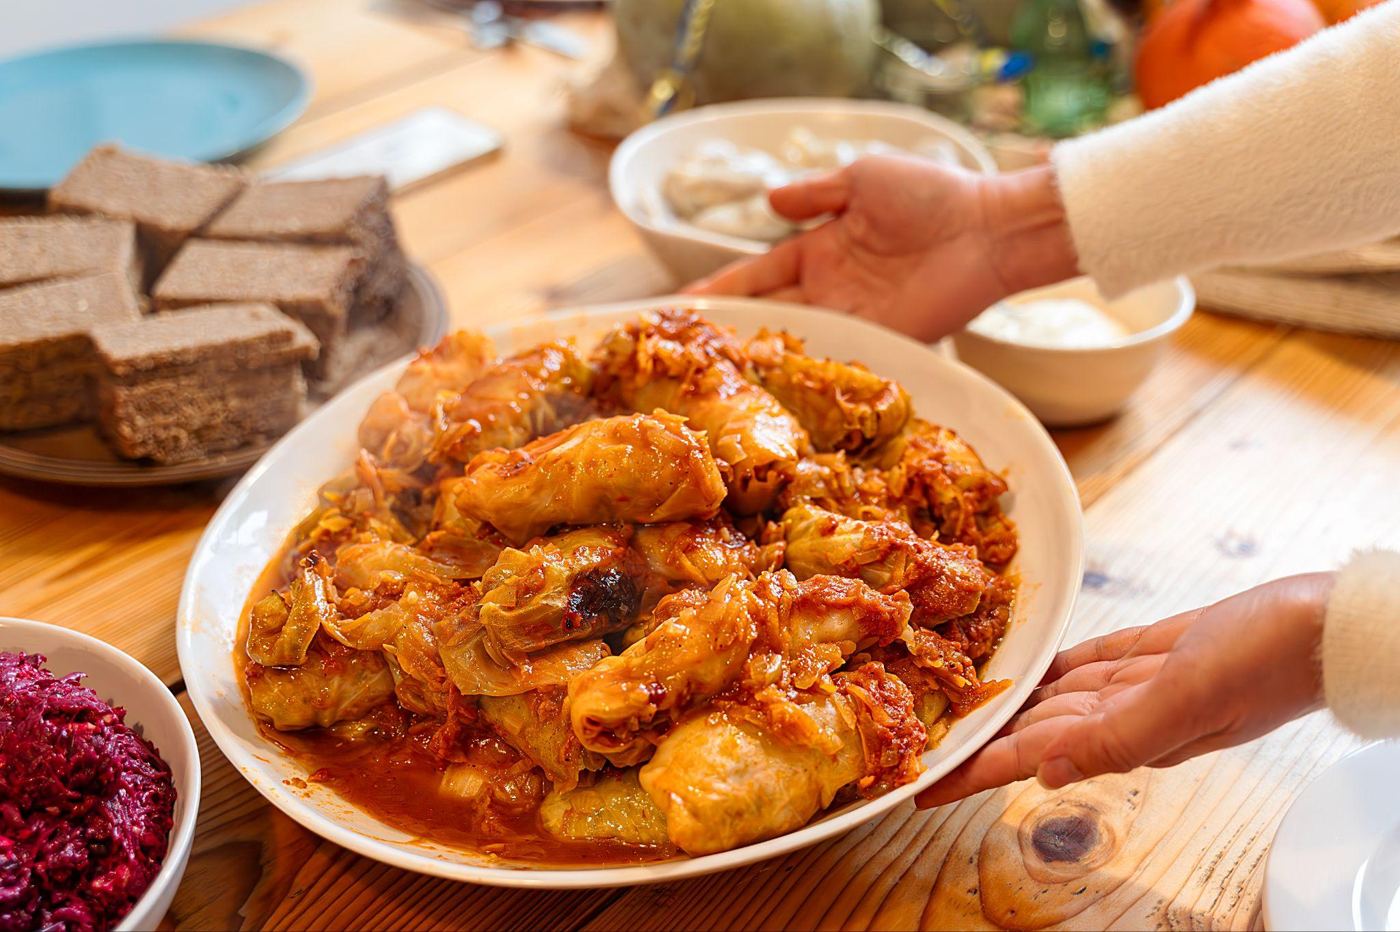
Coexist Community Kitchen, based in Bristol, uses food to bring people together and support people experiencing social marginalisation, including refugees and people seeking asylum. Through free outreach cooking programmes such as Speak & Eat, participants prepare and share meals from around the world while also improving their English in a relaxed, welcoming environment. The sessions combine practical cooking skills with language learning, cultural exchange and opportunities to build friendships. By creating a space where people can contribute their own knowledge and traditions, the programme helps newcomers develop confidence, reduce isolation and feel part of their local community. It demonstrates how shared food can be a powerful tool for fostering belonging, mutual understanding and social integration.
Visit Coexist Community Kitchen’s website (opens in a new tab) ↗“Our vision is an inclusive world, where everyone is nourished. The idea is that food is a bridge where it’s all about community, connection and resilience.”
Research insights
- People rarely find support through one clear front door. They arrive through councils, housing teams, community groups and word of mouth, and trusted relationships keep them connected.
- Activities such as cooking, sewing, sport and games are often the real way into support, not an optional extra.
- Feeling safe matters, and so does building the independence and confidence to take part in wider community life.
- Sudden relocation breaks the connections people have built, and national systems do little to carry support from one place to the next.
- Much of what holds local welcome together is informal: staff, volunteers and small groups doing referral and relationship work that is rarely recognised or funded.
- How funding is designed matters as much as how much there is. Short grants and tight restrictions make it hard to keep buildings open and support consistent.
Welcome across the UK, by numbers
A live snapshot from the Welcome Coalition database. These figures update automatically as the directory grows.
Where welcome happens
Organisations by region
Most common types of support
Share of organisations offering each
Findings from the mapping report
Selected figures from the Welcome Coalition national mapping report, produced with Just Knowledge for the Henry Smith Foundation.
Two broad types of welcome organisation
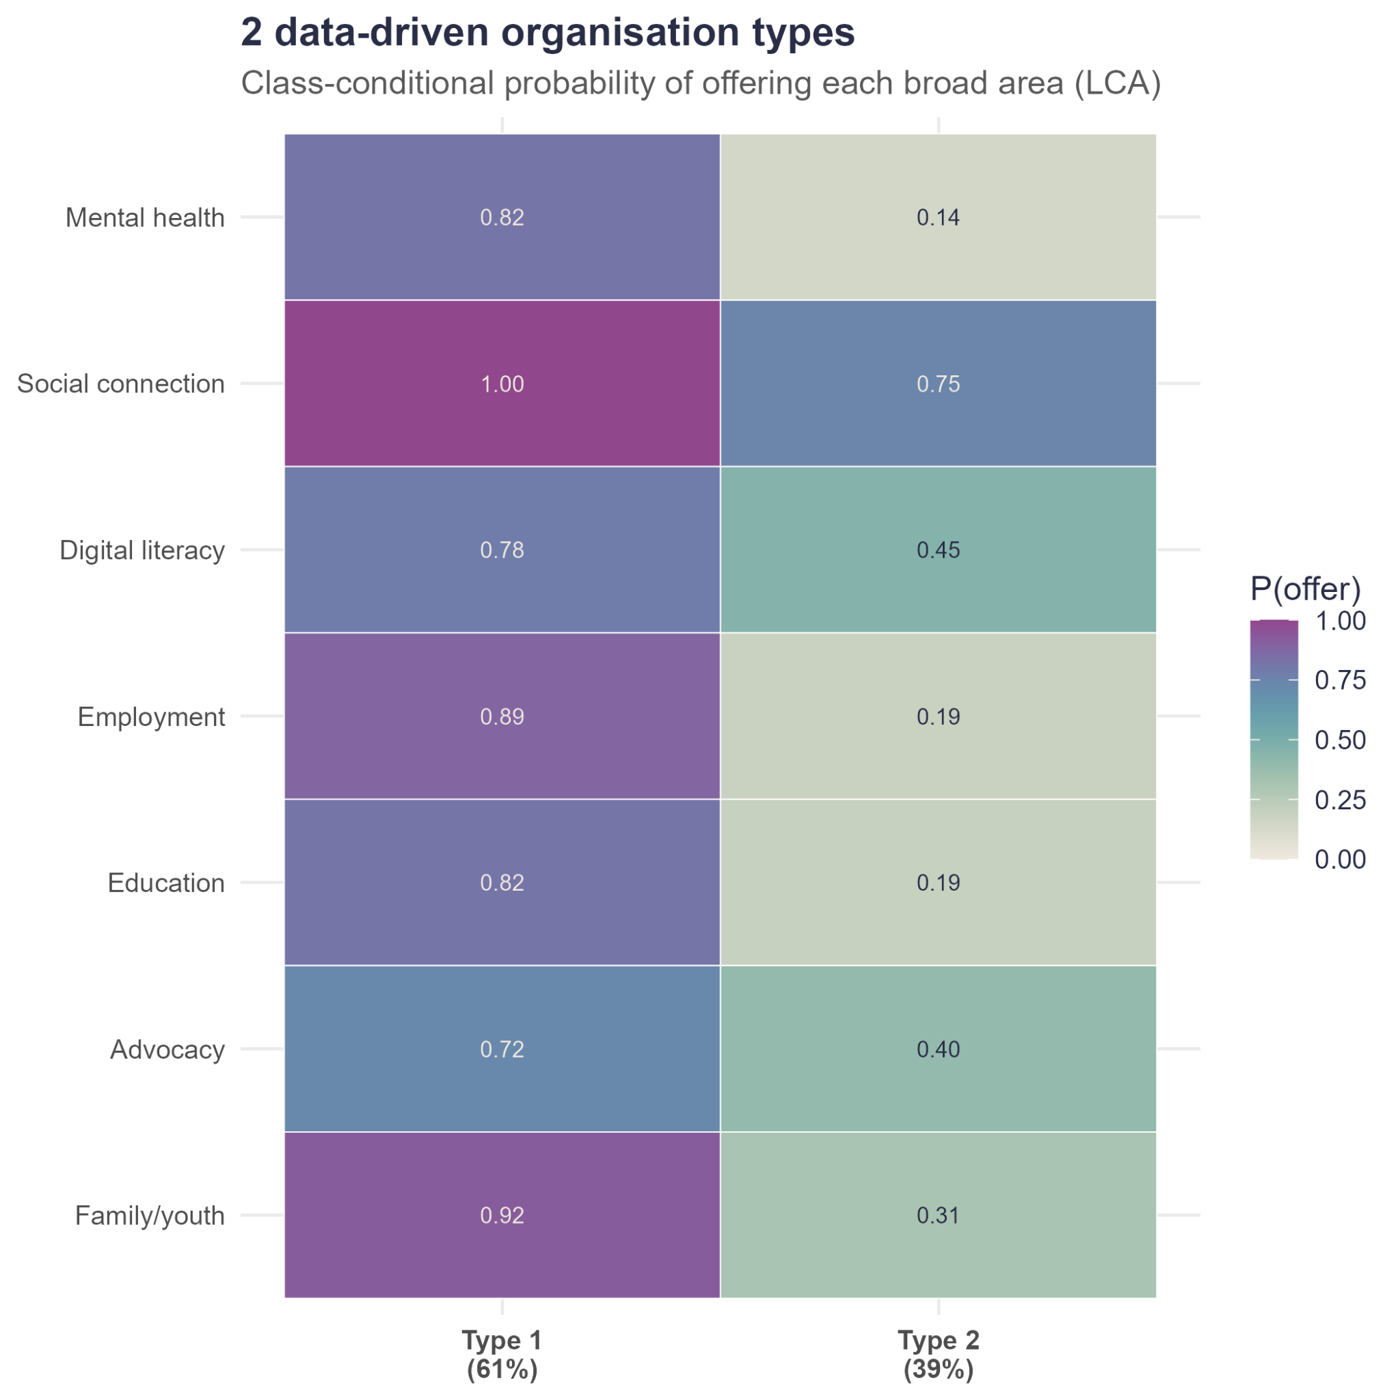 (open full size in a new tab)
Where welcome organisations are, by region
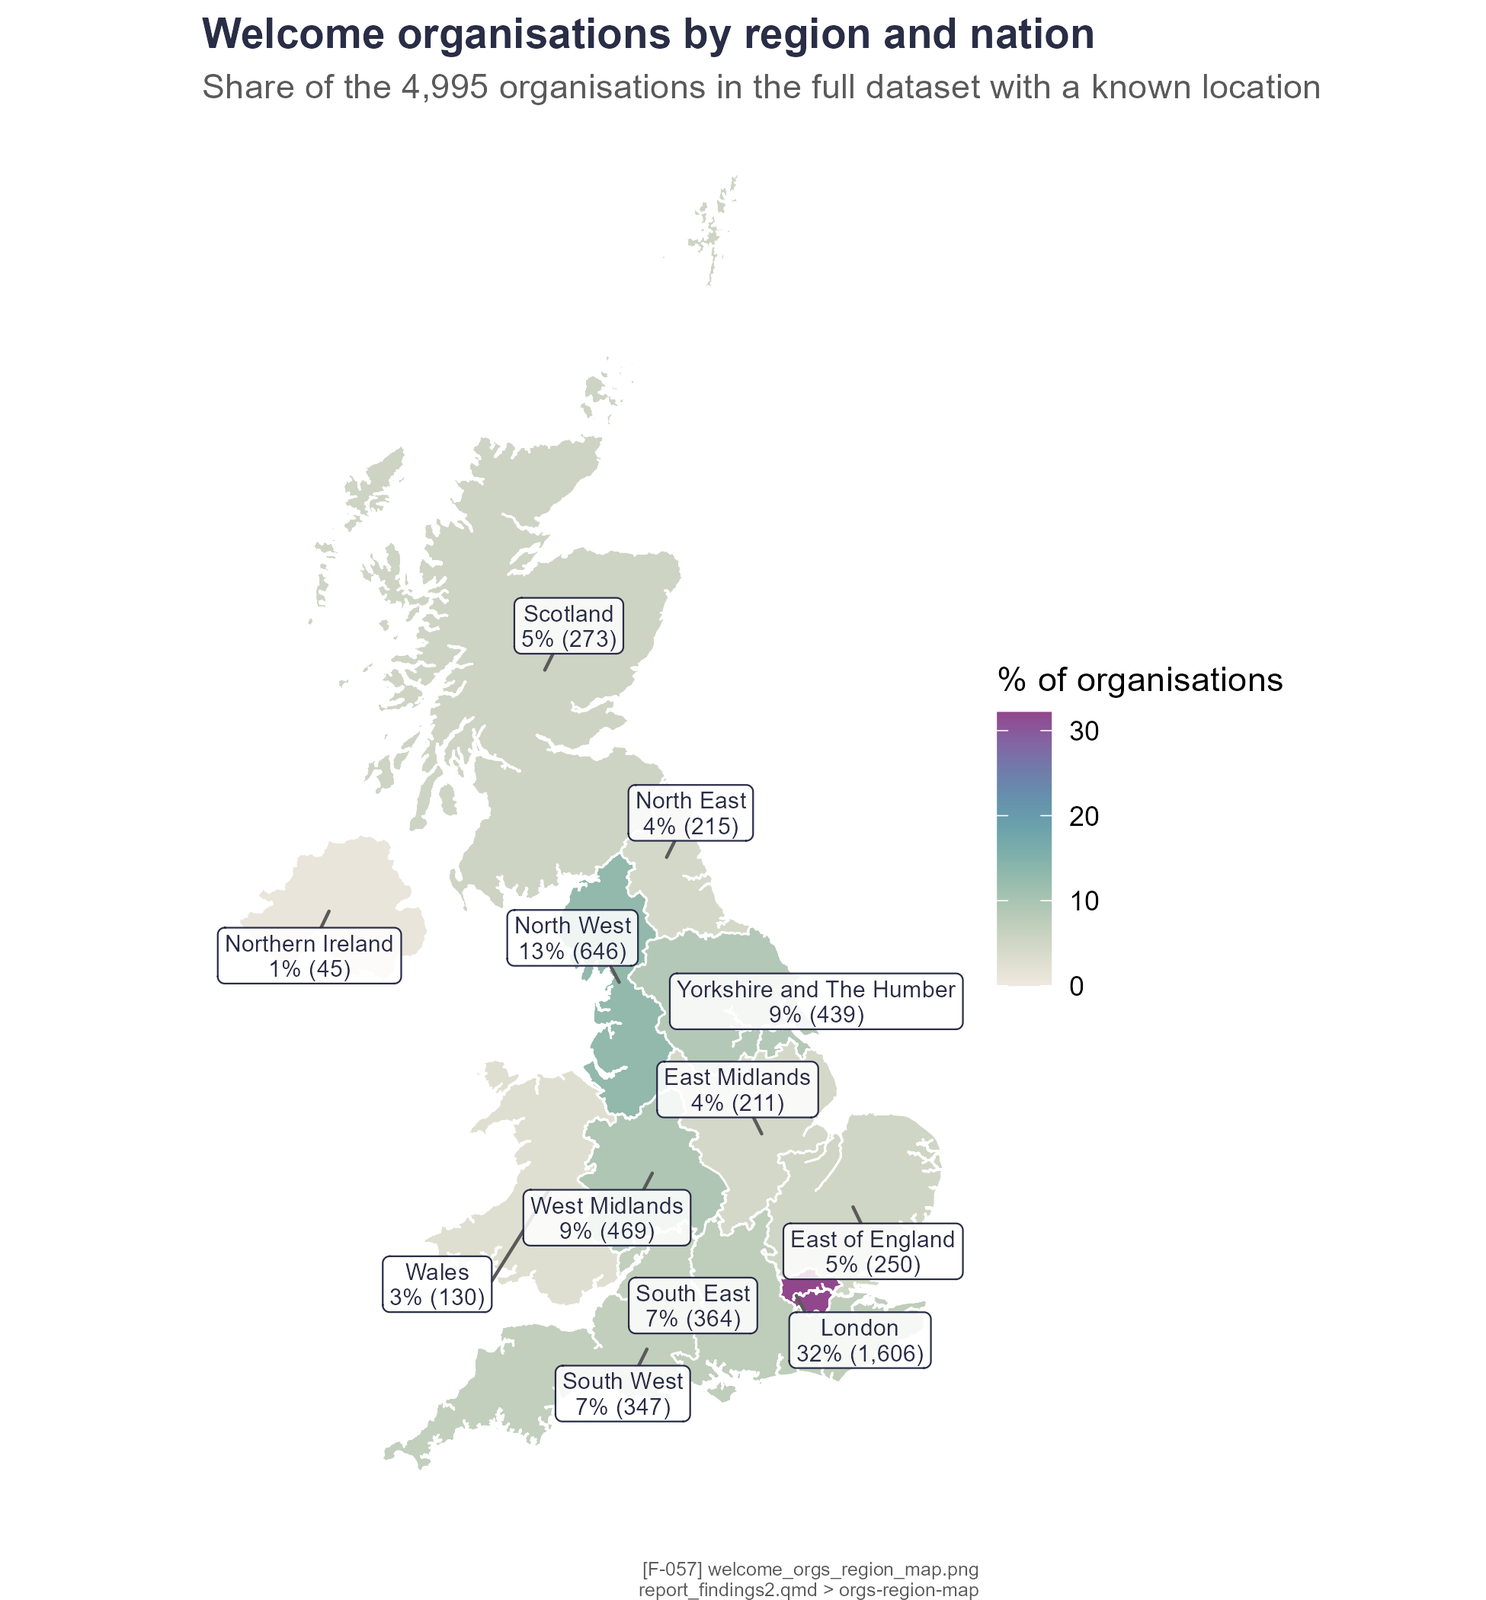 (open full size in a new tab)
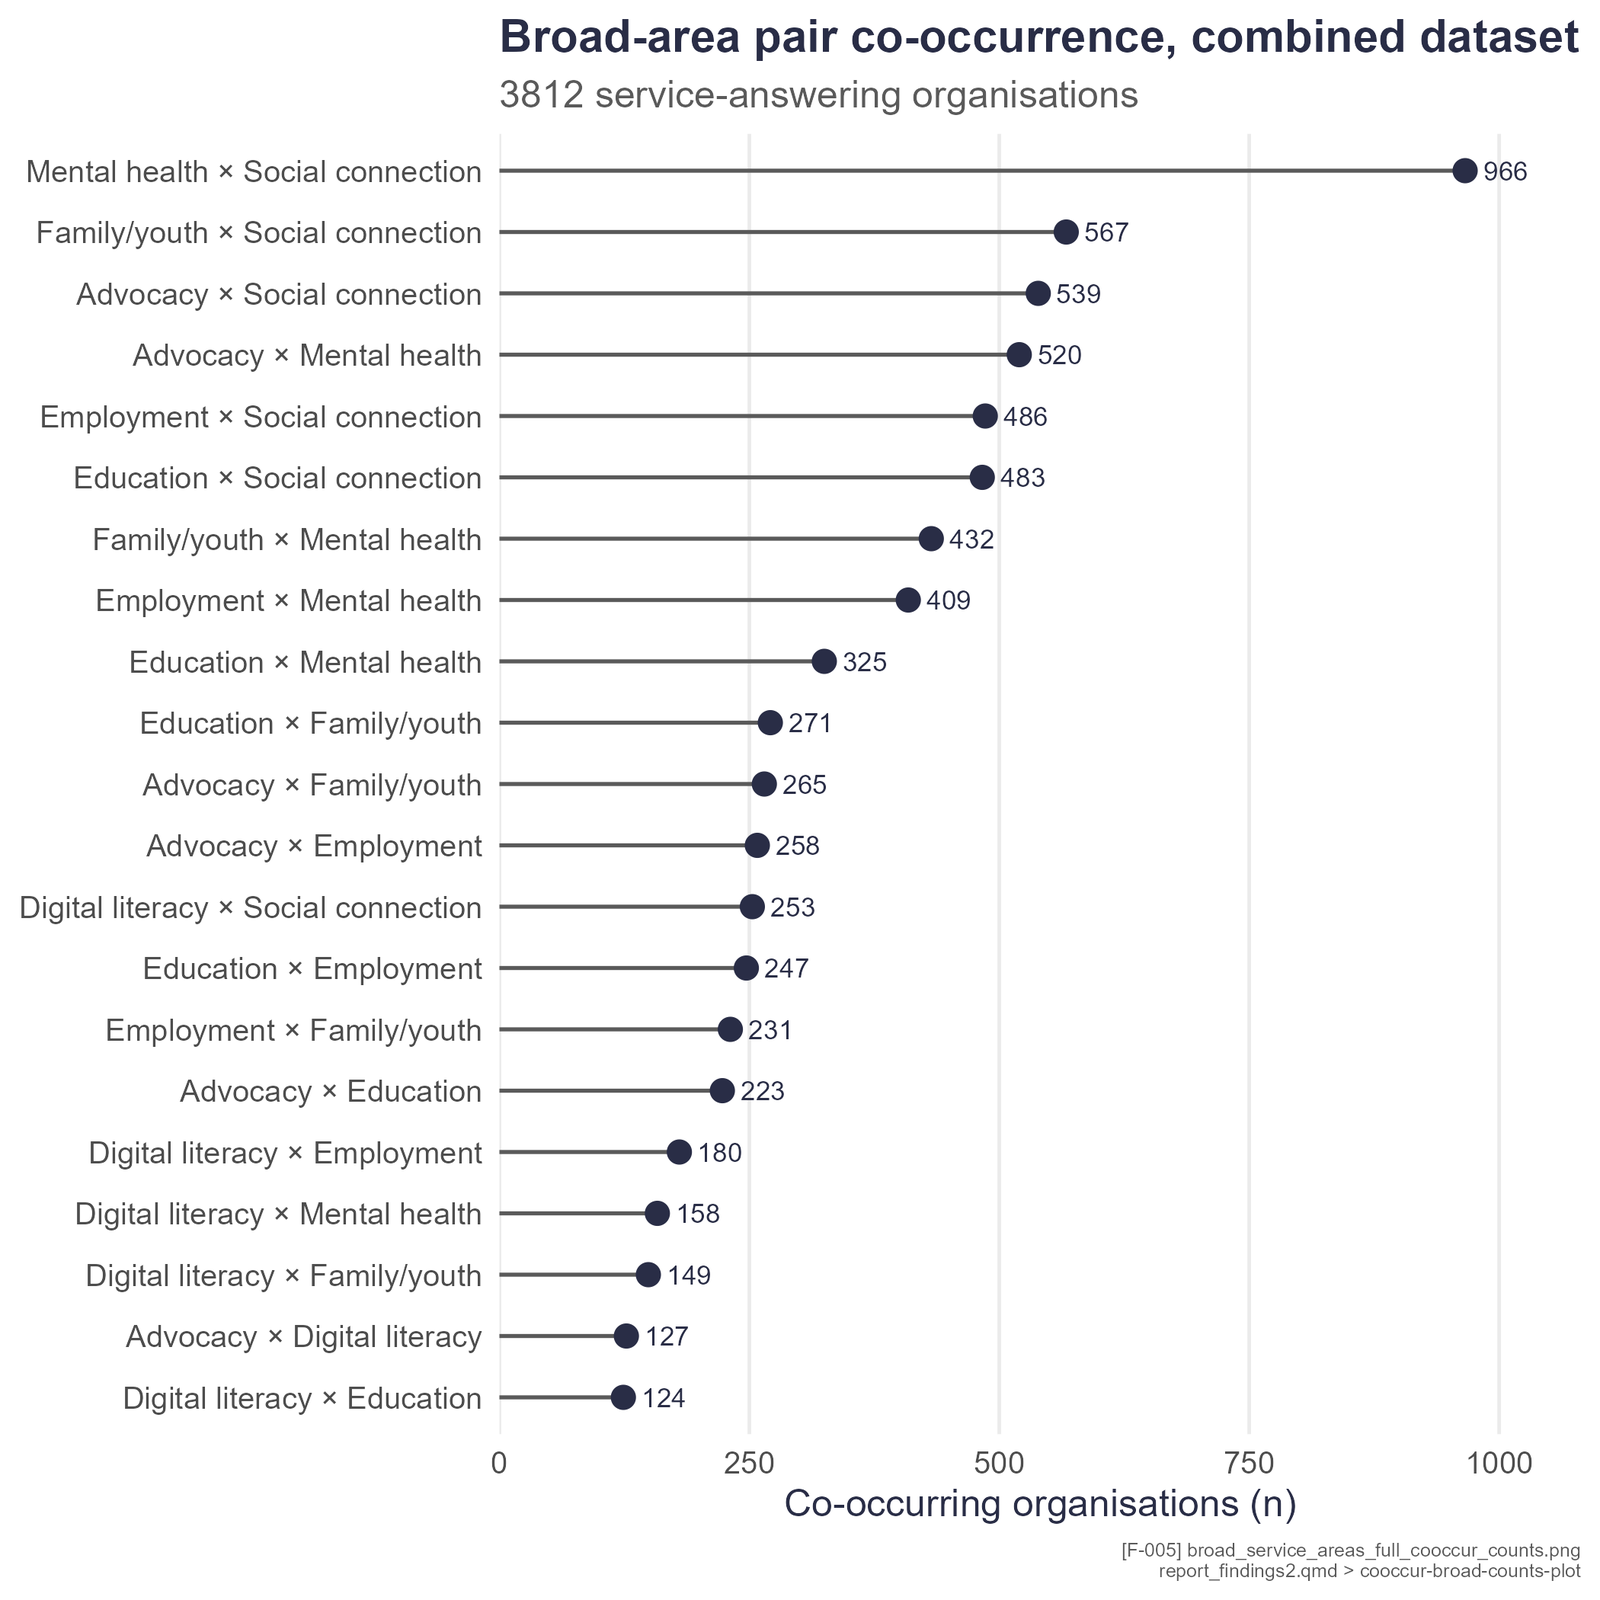
Which services are offered together
 (open full size in a new tab)
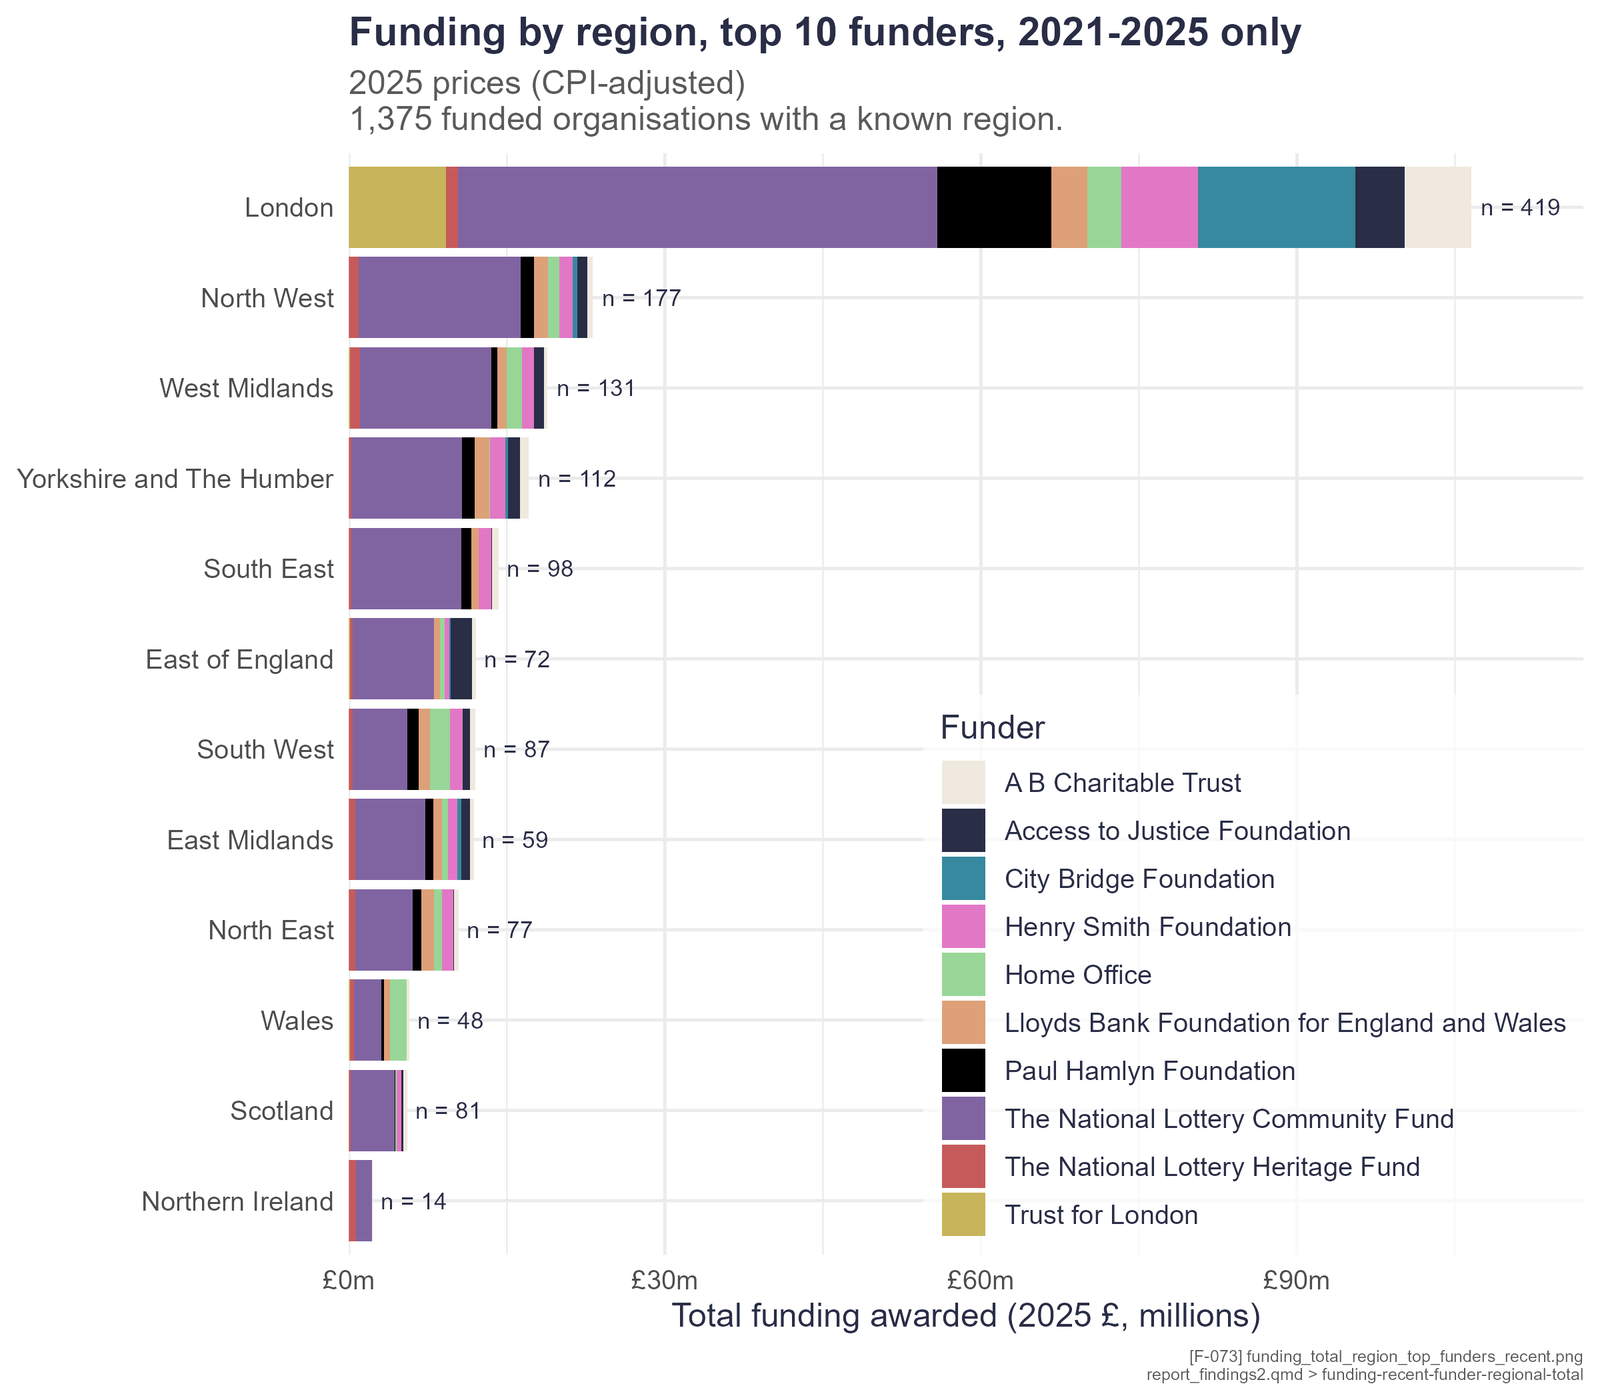
Funding by region
 (open full size in a new tab)
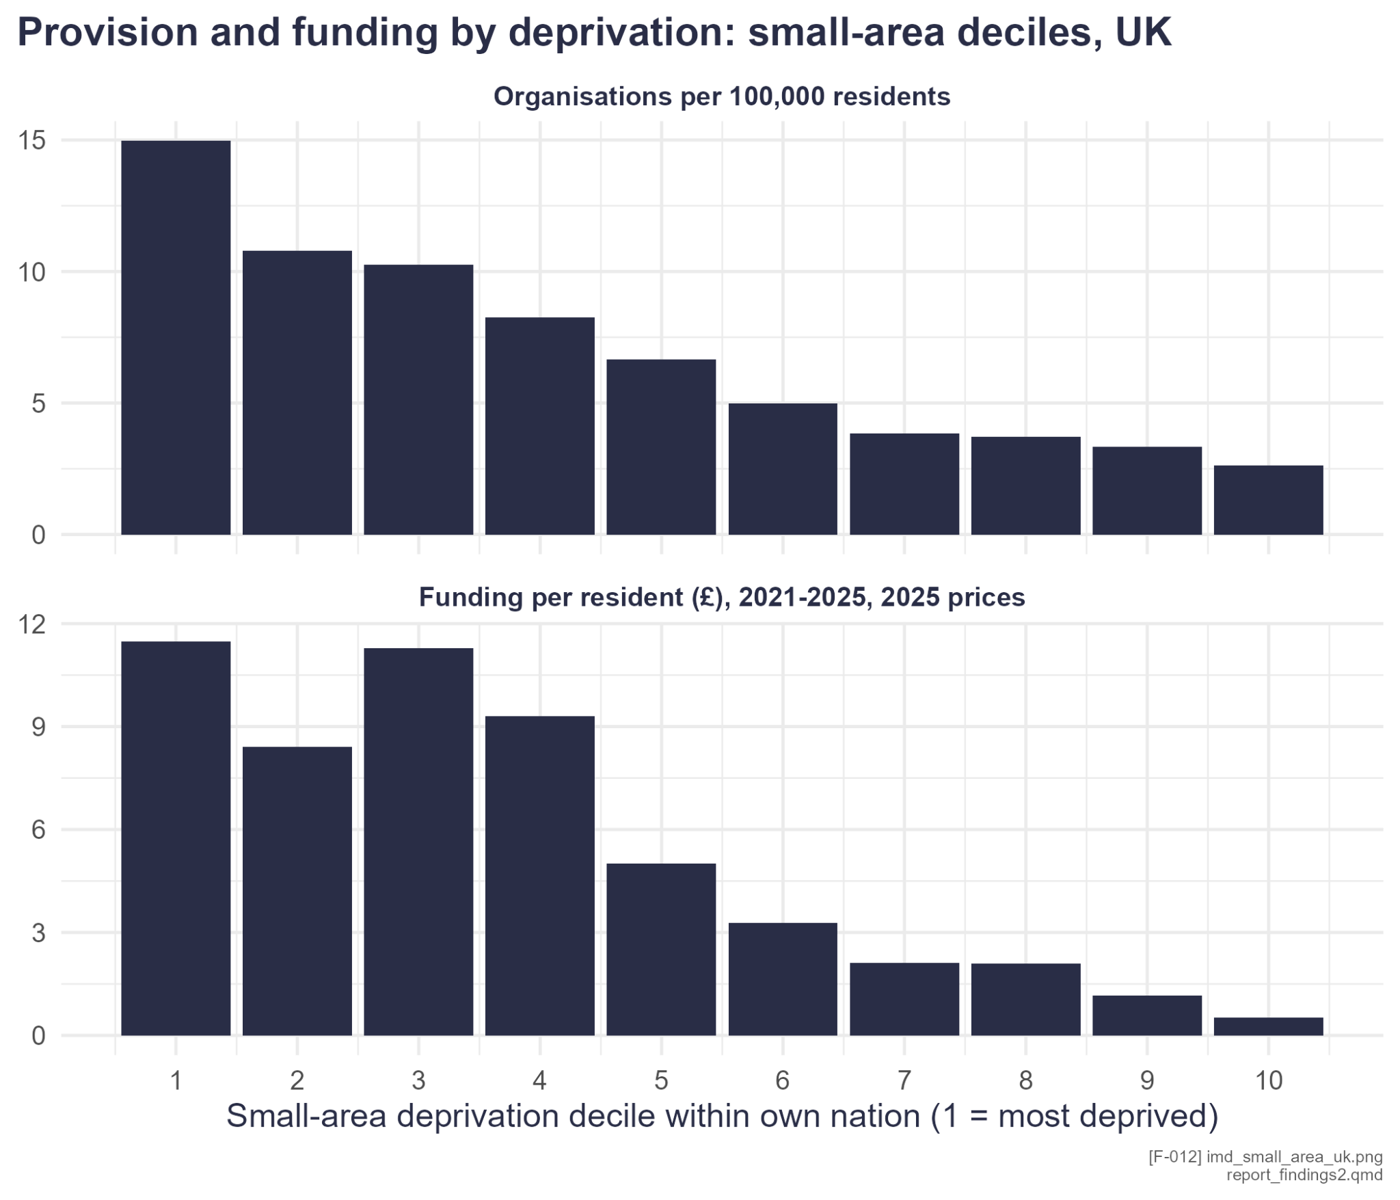
Provision and funding by deprivation
 (open full size in a new tab)
Explore partner databases
Some organisations are listed on trusted partner networks and regional partnerships. We link to those databases rather than copying their entries, so our directory stays accurate:
- Kompasi (opens in a new tab)National
- BRASP (opens in a new tab)South West
- INREN (opens in a new tab)Scotland
- Migrefhealth (opens in a new tab)East of England & London
- Migrant Advice Portal (opens in a new tab)West Midlands
- Migration Yorkshire (opens in a new tab)Yorkshire and the Humber
Explore the data yourself
See where welcome happens on the interactive map, or search the full directory of organisations.